function celsius = temp_conv_f2c(fahrenheit)

celsius = (fahrenheit-32)/1.8;

disp(['The temperature is ',num2str(fahrenheit),' degrees Fahrenheit, which corresponds to ',num2str(celsius),' degrees Celsius.'])

end
function fahrenheit = temp_conv_c2f(celsius)
fahrenheit = 1.8*celsius+32;
disp(['The temperature is ',num2str(celsius),' degrees Celsius, which corresponds to ',num2str(fahrenheit),' degrees Fahrenheit.'])
endfunction volume = vol_cone(radius,height)
volume = (pi*height*radius^2)/3;
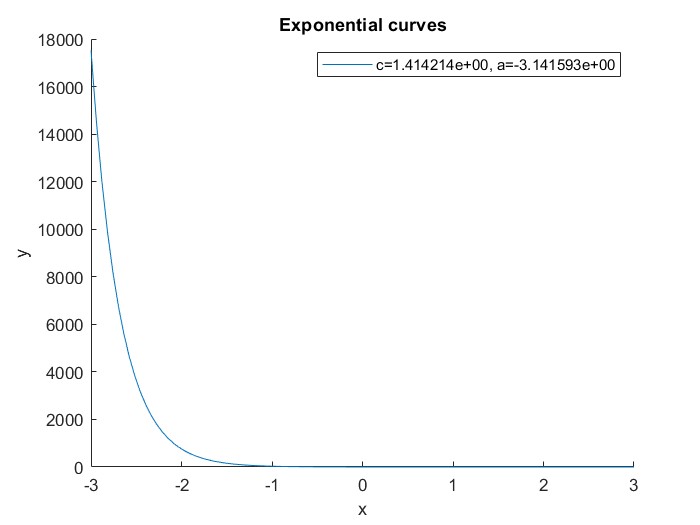
endfunction plot_exp(c,a)
if imag(c)==0&&imag(a)==0
x = linspace(-3,3,100);
y = c*exp(a*x);
plot(x,y)
else
disp("Error! Either a or c might be complex.")
end
endcn = [1,1,1,-1,-1];
an = [0,1,-1,-1,1];
labels = cell(1,length(cn));
for count = 1:1:length(cn)
plot_exp(cn(count),an(count))
hold on
labels{count} = sprintf('c=%d, a=%d', cn(count), an(count));
end
xlabel('x');
ylabel('y');
title('Exponential curves')
legend(labels)
hold off>> % Question 1
>> temp_conv_c2f(0);temp_conv_c2f(25);temp_conv_c2f(37.77);
The temperature is 0 degrees Celsius, which corresponds to 32 degrees Fahrenheit.
The temperature is 25 degrees Celsius, which corresponds to 77 degrees Fahrenheit.
The temperature is 37.77 degrees Celsius, which corresponds to 99.986 degrees Fahrenheit.
>> temp_conv_f2c(32);temp_conv_f2c(100);
The temperature is 32 degrees Fahrenheit, which corresponds to 0 degrees Celsius.
The temperature is 100 degrees Fahrenheit, which corresponds to 37.7778 degrees Celsius.
>> % Question 2
>> vol_cone(4,6.1)
ans =
102.2065
>> % Question 3
>> plot_curves/MATLAB/exp_graphs.jpg)
Encountered errors, so re-wrote plot_curves.m and plot_exp.m:
function plot_exp(c,a)

if imag(c)==0&&imag(a)==0

x = linspace(-3,3,100);

y = c*exp(a*x);

plot(x,y)

disp("Plotted succesfully.")

else

disp("Error! Either a or c might be complex.")

end

end
cn = [2,sqrt(15)-1i,sqrt(2)];
an = [3-2i,12,-pi];
labels = {};
for count = 1:1:length(cn)
plot_exp(cn(count),an(count));
hold on;
if imag(cn(count))==0&&imag(an(count))==0
labels{end+1} = sprintf('c=%d, a=%d', cn(count), an(count));
end
end
xlabel('x');
ylabel('y');
title('Exponential curves');
legend(labels);
hold off;>> plot_curves
Error! Either a or c might be complex.
Error! Either a or c might be complex.
Plotted succesfully.